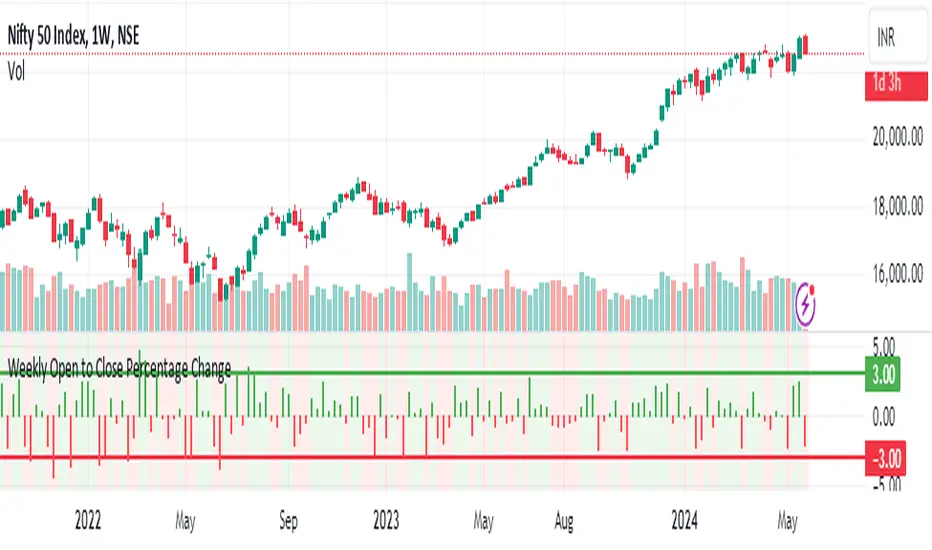
Weekly Open to Close Percentage ChangeThe "Weekly Open to Close Percentage Change Indicator" is a powerful tool designed to help traders and investors track the percentage change in price from the open of the current week's candle to its close. This indicator provides a clear visualization of how the price has moved within the week, offering valuable insights into weekly market trends and momentum.
Key Features:
Weekly Analysis: Focuses on weekly time frames, making it ideal for swing traders and long-term investors.
Percentage Change Calculation: Accurately calculates the percentage change from the open price of the current week's candle to the close price.
Color-Coded Visualization: Uses color coding to differentiate between positive and negative changes:
Green for positive percentage changes (price increase).
Red for negative percentage changes (price decrease).
Histogram Display: Plots the percentage change as a histogram for easy visual interpretation.
Background Highlighting: Adds a background color with transparency to highlight the nature of the change, enhancing chart readability.
Optional Labels: Includes an option to display percentage change values as small dots at the top for quick reference.
How to Use:
Add the script to your TradingView chart by opening the Pine Editor, pasting the script, and saving it.
Apply the indicator to your chart. It will automatically calculate and display the weekly percentage change.
Use the color-coded histogram and background to quickly assess weekly price movements and make informed trading decisions.
Use Cases:
Trend Identification: Quickly identify whether the market is trending upwards or downwards on a weekly basis.
Market Sentiment: Gauge the market sentiment by observing the weekly price changes.
Swing Trading: Ideal for swing traders who base their strategies on weekly price movements.
Note: This indicator is designed for educational and informational purposes. Always conduct thorough analysis and consider multiple indicators and factors when making trading decisions.
In den Scripts nach "swing trading" suchen
Adaptive Moving Average (AMA) Signals (Zeiierman)█ Overview
The Adaptive Moving Average (AMA) Signals indicator, enhances the classic concept of moving averages by making them adaptive to the market's volatility. This adaptability makes the AMA particularly useful in identifying market trends with varying degrees of volatility.
The core of the AMA's adaptability lies in its Efficiency Ratio (ER), which measures the directionality of the market over a given period. The ER is calculated by dividing the absolute change in price over a period by the sum of the absolute differences in daily prices over the same period.
⚪ Why It's Useful
The AMA Signals indicator is particularly useful because of its adaptability to changing market conditions. Unlike static moving averages, it dynamically adjusts, providing more relevant signals that can help traders capture trends earlier or identify reversals with greater accuracy. Its configurability makes it suitable for various trading strategies and timeframes, from day trading to swing trading.
█ How It Works
The AMA Signals indicator operates on the principle of adapting to market efficiency through the calculation of the Efficiency Ratio (ER), which measures the directionality of the market over a specified period. By comparing the net price change to total price movements, the AMA adjusts its sensitivity, becoming faster during trending markets and slower during sideways markets. This adaptability is enhanced by a gamma parameter that filters signals for either trend continuation or reversal, making it versatile across different market conditions.
change = math.abs(close - close )
volatility = math.sum(math.abs(close - close ), n)
ER = change / volatility
Efficiency Ratio (ER) Calculation: The AMA begins with the computation of the Efficiency Ratio (ER), which measures the market's directionality over a specified period. The ER is a ratio of the net price change to the total price movements, serving as a measure of the efficiency of price movements.
Adaptive Smoothing: Based on the ER, the indicator calculates the smoothing constants for the fastest and slowest Exponential Moving Averages (EMAs). These constants are then used to compute a Scaled Smoothing Coefficient (SC) that adapts the moving average to the market's efficiency, making it faster during trending periods and slower in sideways markets.
Signal Generation: The AMA applies a filter, adjusted by a "gamma" parameter, to identify trading signals. This gamma influences the sensitivity towards trend or reversal signals, with options to adjust for focusing on either trend-following or counter-trend signals.
█ How to Use
Trend Identification: Use the AMA to identify the direction of the trend. An upward moving AMA indicates a bullish trend, while a downward moving AMA suggests a bearish trend.
Trend Trading: Look for buy signals when the AMA is trending upwards and sell signals during a downward trend. Adjust the fast and slow EMA lengths to match the desired sensitivity and timeframe.
Reversal Trading: Set the gamma to a positive value to focus on reversal signals, identifying potential market turnarounds.
█ Settings
Period for ER calculation: Defines the lookback period for calculating the Efficiency Ratio, affecting how quickly the AMA responds to changes in market efficiency.
Fast EMA Length and Slow EMA Length: Determine the responsiveness of the AMA to recent price changes, allowing traders to fine-tune the indicator to their trading style.
Signal Gamma: Adjusts the sensitivity of the filter applied to the AMA, with the ability to focus on trend signals or reversal signals based on its value.
AMA Candles: An innovative feature that plots candles based on the AMA calculation, providing visual cues about the market trend and potential reversals.
█ Alerts
The AMA Signals indicator includes configurable alerts for buy and sell signals, as well as positive and negative trend changes.
-----------------
Disclaimer
The information contained in my Scripts/Indicators/Ideas/Algos/Systems does not constitute financial advice or a solicitation to buy or sell any securities of any type. I will not accept liability for any loss or damage, including without limitation any loss of profit, which may arise directly or indirectly from the use of or reliance on such information.
All investments involve risk, and the past performance of a security, industry, sector, market, financial product, trading strategy, backtest, or individual's trading does not guarantee future results or returns. Investors are fully responsible for any investment decisions they make. Such decisions should be based solely on an evaluation of their financial circumstances, investment objectives, risk tolerance, and liquidity needs.
My Scripts/Indicators/Ideas/Algos/Systems are only for educational purposes!

Candlestick Bias OscillatorCandlestick Bias Oscillator (CBO)
The Candlestick Bias Oscillator (CBO) with Signal Line is a pioneering indicator developed for the TradingView platform, designed to offer traders a nuanced analysis of market sentiment through the unique lens of candlestick patterns. This indicator stands out by merging traditional concepts of price action analysis with innovative mathematical computations, providing a fresh perspective on trend detection and potential market reversals.
Originality and Utility
At the core of the CBO's originality is its method of calculating the bias of candlesticks. Unlike conventional oscillators that may rely solely on closing prices or high-low ranges, the CBO incorporates both the body and wick of candlesticks into its analysis. This dual consideration allows for a more rounded understanding of market sentiment, capturing both the directional momentum and the strength of price rejections within a single oscillator.
Mathematical Foundations
1. Body Bias: The CBO calculates the body bias by assessing the relative position of the close to the open within the day's range, scaled to a -100 to 100 range. This calculation reflects the bullish or bearish sentiment of the market, based on the day's closing momentum.
Body Bias = (Close−Open)/(High−Low) x 100
Wick Bias: Similarly, the wick bias calculation takes into account the lengths of the upper and lower wicks, indicating rejection levels beyond the body's close. The balance between these wicks is scaled similarly to the body bias, offering insight into the market's indecision or rejection of certain price levels.
Wick Bias=(Lower Wick−Upper Wick)/(Total Wick Length) × 100
3. Overall Bias and Oscillator: By averaging the body and wick biases, the CBO yields an overall bias score, which is then smoothed over a user-defined period to create the oscillator. This oscillator provides a clear visual representation of the market's underlying sentiment, smoothed to filter out the noise.
4. Signal Line: A secondary smoothing of the oscillator creates the signal line, offering a trigger for potential trading signals when the oscillator crosses this line, indicative of a change in market momentum.
How to Use the CBO:
The CBO is versatile, suitable for various trading strategies, including scalping, swing trading, and long-term trend following. Traders can use the oscillator and signal line crossovers as indications for entry or exit points. The relative position of the oscillator to the zero line further provides insight into the prevailing market bias, enabling traders to align their strategies with the broader market sentiment.
Why It Adds Value:
The CBO's innovative approach to analyzing candlestick patterns fills a gap in the existing array of TradingView indicators. By providing a detailed analysis of both candle bodies and wicks, the CBO offers a more comprehensive view of market sentiment than traditional oscillators. This can be particularly useful for traders looking to gauge the strength of price movements and potential reversal points with greater precision.
Conclusion:
The Candle Bias Oscillator with Signal Line is not just another addition to the plethora of indicators on TradingView. It represents a significant advancement in the analysis of market sentiment, combining traditional concepts with a novel mathematical approach. By offering a deeper insight into the dynamics of candlestick patterns, the CBO equips traders with a powerful tool to navigate the complexities of the market with increased confidence.
Explore the unique insights provided by the CBO and integrate it into your trading strategy for a more informed and nuanced market analysis.

Bollinger Bands & Fibonacci StrategyThe Bollinger Bands & Fibonacci Strategy is a powerful technical analysis trading strategy designed to identify potential entry and exit points in financial markets. This strategy combines two widely used indicators, Bollinger Bands and Fibonacci retracement levels, to assist traders in making informed trading decisions.
Key Features:
Bollinger Bands: This strategy utilizes Bollinger Bands, a volatility-based indicator that consists of an upper band, a lower band, and a middle (basis) line. Bollinger Bands help traders visualize price volatility and potential reversal points.
Fibonacci Retracement Levels: Fibonacci retracement levels are essential tools for identifying potential support and resistance levels in price charts. This strategy incorporates Fibonacci retracement levels, including the 0% and 100% levels, to aid in pinpointing key price levels.
Long and Short Signals: The strategy generates long (buy) and short (sell) signals based on specific conditions derived from Bollinger Bands and Fibonacci levels. Long signals are generated when price crosses above the upper Bollinger Band and when the price is above the Fibonacci low level. Short signals are generated when price crosses below the lower Bollinger Band and when the price is below the Fibonacci high level.
Position Management: To prevent multiple concurrent positions of the same type (long or short), the strategy employs position management logic. It tracks open positions and ensures that only one position type is active at a time.
Exit Conditions: The strategy includes customizable exit conditions to manage and close open positions. Traders can fine-tune exit criteria to align with their risk management and profit-taking strategies.
User-Friendly: This strategy script is user-friendly and can be easily integrated into the TradingView platform, allowing traders to apply it to various financial instruments and timeframes.
Usage:
Traders and investors can apply the Bollinger Bands & Fibonacci Strategy to a wide range of financial markets, including stocks, forex, commodities, and cryptocurrencies. It can be adapted to different timeframes to suit various trading styles, from day trading to swing trading.
Disclaimer:
Trading carries inherent risks, and this strategy is no exception. It is essential to use proper risk management techniques, including stop-loss orders, and thoroughly backtest the strategy on historical data before implementing it in live trading.
The Bollinger Bands & Fibonacci Strategy is a valuable tool for technical traders seeking well-defined entry and exit points based on robust indicators. It can serve as a foundation for traders to build and customize their trading strategies according to their individual preferences and risk tolerance.
Feel free to customize this description to add any additional details or specifications unique to your strategy. When publishing your strategy on a trading platform like TradingView, a clear and informative description can help potential users understand and use your strategy effectively.

W and M Pattern Indicator- SwaGThis is a TradingView indicator script that identifies potential buy and sell signals based on ‘W’ and ‘M’ patterns in the Relative Strength Index (RSI). It provides visual alerts and draws horizontal lines to indicate potential trade entry points.
User Manual:
Inputs: The script takes two inputs - an upper limit and a lower limit. The default values are 70 and 40, respectively.
RSI Calculation: The script calculates the RSI based on the closing prices of the last 14 periods.
Pattern Identification: It identifies ‘W’ patterns when the RSI makes a higher low within the lower limit, and ‘M’ patterns when the RSI makes a lower high within the upper limit.
Visual Alerts: The script plots these patterns on the chart. ‘W’ patterns are marked with small green triangles below the bars, and ‘M’ patterns are marked with small red triangles above the bars.
Trade Entry Points: A horizontal line is drawn at the high or low of the candle to represent potential trade entry points. The line starts from one bar to the left and extends 10 bars to the right.
Trading Strategy:
For investing, use a weekly timeframe.
For swing trading, use a daily timeframe.
For intraday trading, use a 5 or 15-minute timeframe. Only consider sell-side signals for intraday trading.
Take a buy position if the high breaks above the green line or sell if the low breaks below the red line.
Use recent signals only and avoid signals that are too old.
Swing highs or lows will be your stop-loss level.
Always think about your stop-loss before entering a trade, not your target.
Avoid trades with a large stop-loss.
Remember, this script is a tool to aid in your trading decisions. Always test your strategies thoroughly before live trading. Happy trading! 😊

Moving Average Filters Add-on w/ Expanded Source Types [Loxx]Moving Average Filters Add-on w/ Expanded Source Types is a conglomeration of specialized and traditional moving averages that will be used in most of indicators that I publish moving forward. There are 39 moving averages included in this indicator as well as expanded source types including traditional Heiken Ashi and Better Heiken Ashi candles. You can read about the expanded source types clicking here . About half of these moving averages are closed source on other trading platforms. This indicator serves as a reference point for future public/private, open/closed source indicators that I publish to TradingView. Information about these moving averages was gleaned from various forex and trading forums and platforms as well as TASC publications and other assorted research publications.
________________________________________________________________
Included moving averages
ADXvma - Average Directional Volatility Moving Average
Linnsoft's ADXvma formula is a volatility-based moving average, with the volatility being determined by the value of the ADX indicator.
The ADXvma has the SMA in Chande's CMO replaced with an EMA, it then uses a few more layers of EMA smoothing before the "Volatility Index" is calculated.
A side effect is, those additional layers slow down the ADXvma when you compare it to Chande's Variable Index Dynamic Average VIDYA.
The ADXVMA provides support during uptrends and resistance during downtrends and will stay flat for longer, but will create some of the most accurate market signals when it decides to move.
Ahrens Moving Average
Richard D. Ahrens's Moving Average promises "Smoother Data" that isn't influenced by the occasional price spike. It works by using the Open and the Close in his formula so that the only time the Ahrens Moving Average will change is when the candlestick is either making new highs or new lows.
Alexander Moving Average - ALXMA
This Moving Average uses an elaborate smoothing formula and utilizes a 7 period Moving Average. It corresponds to fitting a second-order polynomial to seven consecutive observations. This moving average is rarely used in trading but is interesting as this Moving Average has been applied to diffusion indexes that tend to be very volatile.
Double Exponential Moving Average - DEMA
The Double Exponential Moving Average (DEMA) combines a smoothed EMA and a single EMA to provide a low-lag indicator. It's primary purpose is to reduce the amount of "lagging entry" opportunities, and like all Moving Averages, the DEMA confirms uptrends whenever price crosses on top of it and closes above it, and confirms downtrends when the price crosses under it and closes below it - but with significantly less lag.
Double Smoothed Exponential Moving Average - DSEMA
The Double Smoothed Exponential Moving Average is a lot less laggy compared to a traditional EMA. It's also considered a leading indicator compared to the EMA, and is best utilized whenever smoothness and speed of reaction to market changes are required.
Exponential Moving Average - EMA
The EMA places more significance on recent data points and moves closer to price than the SMA (Simple Moving Average). It reacts faster to volatility due to its emphasis on recent data and is known for its ability to give greater weight to recent and more relevant data. The EMA is therefore seen as an enhancement over the SMA.
Fast Exponential Moving Average - FEMA
An Exponential Moving Average with a short look-back period.
Fractal Adaptive Moving Average - FRAMA
The Fractal Adaptive Moving Average by John Ehlers is an intelligent adaptive Moving Average which takes the importance of price changes into account and follows price closely enough to display significant moves whilst remaining flat if price ranges. The FRAMA does this by dynamically adjusting the look-back period based on the market's fractal geometry.
Hull Moving Average - HMA
Alan Hull's HMA makes use of weighted moving averages to prioritize recent values and greatly reduce lag whilst maintaining the smoothness of a traditional Moving Average. For this reason, it's seen as a well-suited Moving Average for identifying entry points.
IE/2 - Early T3 by Tim Tilson
The IE/2 is a Moving Average that uses Linear Regression slope in its calculation to help with smoothing. It's a worthy Moving Average on it's own, even though it is the precursor and very early version of the famous "T3 Indicator".
Integral of Linear Regression Slope - ILRS
A Moving Average where the slope of a linear regression line is simply integrated as it is fitted in a moving window of length N (natural numbers in maths) across the data. The derivative of ILRS is the linear regression slope. ILRS is not the same as a SMA (Simple Moving Average) of length N, which is actually the midpoint of the linear regression line as it moves across the data.
Instantaneous Trendline
The Instantaneous Trendline is created by removing the dominant cycle component from the price information which makes this Moving Average suitable for medium to long-term trading.
Laguerre Filter
The Laguerre Filter is a smoothing filter which is based on Laguerre polynomials. The filter requires the current price, three prior prices, a user defined factor called Alpha to fill its calculation.
Adjusting the Alpha coefficient is used to increase or decrease its lag and it's smoothness.
Leader Exponential Moving Average
The Leader EMA was created by Giorgos E. Siligardos who created a Moving Average which was able to eliminate lag altogether whilst maintaining some smoothness. It was first described during his research paper "MACD Leader" where he applied this to the MACD to improve its signals and remove its lagging issue. This filter uses his leading MACD's "modified EMA" and can be used as a zero lag filter.
Linear Regression Value - LSMA (Least Squares Moving Average)
LSMA as a Moving Average is based on plotting the end point of the linear regression line. It compares the current value to the prior value and a determination is made of a possible trend, eg. the linear regression line is pointing up or down.
Linear Weighted Moving Average - LWMA
LWMA reacts to price quicker than the SMA and EMA. Although it's similar to the Simple Moving Average, the difference is that a weight coefficient is multiplied to the price which means the most recent price has the highest weighting, and each prior price has progressively less weight. The weights drop in a linear fashion.
McGinley Dynamic
John McGinley created this Moving Average to track price better than traditional Moving Averages. It does this by incorporating an automatic adjustment factor into its formula, which speeds (or slows) the indicator in trending, or ranging, markets.
McNicholl EMA
Dennis McNicholl developed this Moving Average to use as his center line for his "Better Bollinger Bands" indicator and was successful because it responded better to volatility changes over the standard SMA and managed to avoid common whipsaws.
Non lag moving average
The Non Lag Moving average follows price closely and gives very quick signals as well as early signals of price change. As a standalone Moving Average, it should not be used on its own, but as an additional confluence tool for early signals.
Parabolic Weighted Moving Average
The Parabolic Weighted Moving Average is a variation of the Linear Weighted Moving Average. The Linear Weighted Moving Average calculates the average by assigning different weight to each element in its calculation. The Parabolic Weighted Moving Average is a variation that allows weights to be changed to form a parabolic curve. It is done simply by using the Power parameter of this indicator.
Recursive Moving Trendline
Dennis Meyers's Recursive Moving Trendline uses a recursive (repeated application of a rule) polynomial fit, a technique that uses a small number of past values estimations of price and today's price to predict tomorrows price.
Simple Moving Average - SMA
The SMA calculates the average of a range of prices by adding recent prices and then dividing that figure by the number of time periods in the calculation average. It is the most basic Moving Average which is seen as a reliable tool for starting off with Moving Average studies. As reliable as it may be, the basic moving average will work better when it's enhanced into an EMA.
Sine Weighted Moving Average
The Sine Weighted Moving Average assigns the most weight at the middle of the data set. It does this by weighting from the first half of a Sine Wave Cycle and the most weighting is given to the data in the middle of that data set. The Sine WMA closely resembles the TMA (Triangular Moving Average).
Smoothed Moving Average - SMMA
The Smoothed Moving Average is similar to the Simple Moving Average (SMA), but aims to reduce noise rather than reduce lag. SMMA takes all prices into account and uses a long lookback period. Due to this, it's seen a an accurate yet laggy Moving Average.
Smoother
The Smoother filter is a faster-reacting smoothing technique which generates considerably less lag than the SMMA (Smoothed Moving Average). It gives earlier signals but can also create false signals due to its earlier reactions. This filter is sometimes wrongly mistaken for the superior Jurik Smoothing algorithm.
Super Smoother
The Super Smoother filter uses John Ehlers’s “Super Smoother” which consists of a a Two pole Butterworth filter combined with a 2-bar SMA (Simple Moving Average) that suppresses the 22050 Hz Nyquist frequency: A characteristic of a sampler, which converts a continuous function or signal into a discrete sequence.
Three pole Ehlers Butterworth
The 3 pole Ehlers Butterworth (as well as the Two pole Butterworth) are both superior alternatives to the EMA and SMA. They aim at producing less lag whilst maintaining accuracy. The 2 pole filter will give you a better approximation for price, whereas the 3 pole filter has superior smoothing.
Three pole Ehlers smoother
The 3 pole Ehlers smoother works almost as close to price as the above mentioned 3 Pole Ehlers Butterworth. It acts as a strong baseline for signals but removes some noise. Side by side, it hardly differs from the Three Pole Ehlers Butterworth but when examined closely, it has better overshoot reduction compared to the 3 pole Ehlers Butterworth.
Triangular Moving Average - TMA
The TMA is similar to the EMA but uses a different weighting scheme. Exponential and weighted Moving Averages will assign weight to the most recent price data. Simple moving averages will assign the weight equally across all the price data. With a TMA (Triangular Moving Average), it is double smoother (averaged twice) so the majority of the weight is assigned to the middle portion of the data.
The TMA and Sine Weighted Moving Average Filter are almost identical at times.
Triple Exponential Moving Average - TEMA
The TEMA uses multiple EMA calculations as well as subtracting lag to create a tool which can be used for scalping pullbacks. As it follows price closely, it's signals are considered very noisy and should only be used in extremely fast-paced trading conditions.
Two pole Ehlers Butterworth
The 2 pole Ehlers Butterworth (as well as the three pole Butterworth mentioned above) is another filter that cuts out the noise and follows the price closely. The 2 pole is seen as a faster, leading filter over the 3 pole and follows price a bit more closely. Analysts will utilize both a 2 pole and a 3 pole Butterworth on the same chart using the same period, but having both on chart allows its crosses to be traded.
Two pole Ehlers smoother
A smoother version of the Two pole Ehlers Butterworth. This filter is the faster version out of the 3 pole Ehlers Butterworth. It does a decent job at cutting out market noise whilst emphasizing a closer following to price over the 3 pole Ehlers.
Volume Weighted EMA - VEMA
Utilizing tick volume in MT4 (or real volume in MT5), this EMA will use the Volume reading in its decision to plot its moves. The more Volume it detects on a move, the more authority (confirmation) it has. And this EMA uses those Volume readings to plot its movements.
Studies show that tick volume and real volume have a very strong correlation, so using this filter in MT4 or MT5 produces very similar results and readings.
Zero Lag DEMA - Zero Lag Double Exponential Moving Average
John Ehlers's Zero Lag DEMA's aim is to eliminate the inherent lag associated with all trend following indicators which average a price over time. Because this is a Double Exponential Moving Average with Zero Lag, it has a tendency to overshoot and create a lot of false signals for swing trading. It can however be used for quick scalping or as a secondary indicator for confluence.
Zero Lag Moving Average
The Zero Lag Moving Average is described by its creator, John Ehlers, as a Moving Average with absolutely no delay. And it's for this reason that this filter will cause a lot of abrupt signals which will not be ideal for medium to long-term traders. This filter is designed to follow price as close as possible whilst de-lagging data instead of basing it on regular data. The way this is done is by attempting to remove the cumulative effect of the Moving Average.
Zero Lag TEMA - Zero Lag Triple Exponential Moving Average
Just like the Zero Lag DEMA, this filter will give you the fastest signals out of all the Zero Lag Moving Averages. This is useful for scalping but dangerous for medium to long-term traders, especially during market Volatility and news events. Having no lag, this filter also has no smoothing in its signals and can cause some very bizarre behavior when applied to certain indicators.
________________________________________________________________
What are Heiken Ashi "better" candles?
The "better formula" was proposed in an article/memo by BNP-Paribas (In Warrants & Zertifikate, No. 8, August 2004 (a monthly German magazine published by BNP Paribas, Frankfurt), there is an article by Sebastian Schmidt about further development (smoothing) of Heikin-Ashi chart.)
They proposed to use the following:
(Open+Close)/2+(((Close-Open)/( High-Low ))*ABS((Close-Open)/2))
instead of using :
haClose = (O+H+L+C)/4
According to that document the HA representation using their proposed formula is better than the traditional formula.
What are traditional Heiken-Ashi candles?
The Heikin-Ashi technique averages price data to create a Japanese candlestick chart that filters out market noise.
Heikin-Ashi charts, developed by Munehisa Homma in the 1700s, share some characteristics with standard candlestick charts but differ based on the values used to create each candle. Instead of using the open, high, low, and close like standard candlestick charts, the Heikin-Ashi technique uses a modified formula based on two-period averages. This gives the chart a smoother appearance, making it easier to spots trends and reversals, but also obscures gaps and some price data.
Expanded generic source types:
Close = close
Open = open
High = high
Low = low
Median = hl2
Typical = hlc3
Weighted = hlcc4
Average = ohlc4
Average Median Body = (open+close)/2
Trend Biased = (see code, too complex to explain here)
Trend Biased (extreme) = (see code, too complex to explain here)
Included:
-Toggle bar color on/off
-Toggle signal line on/off

Apex Wallet - Real-Time Market Volume Delta & Order FlowOverview The Apex Wallet Market Volume Delta is a professional liquidity analysis tool designed to decode the internal structure of market volume. Unlike standard volume bars, this script calculates the "Delta"—the net difference between buying and selling pressure—to reveal the true conviction of market participants in real-time.
Dynamic Multi-Mode Intelligence This indicator features an adaptive calculation engine that recalibrates its internal logic based on your trading style:
Scalping: Fast-response settings (9-period MA) for immediate execution on low timeframes.
Day-Trading: Balanced settings (26-period MA) optimized for intraday sessions.
Swing-Trading: High-filter settings (52-period MA) for major trend confirmation.
Advanced Order Flow Detection
Real-Time Delta Calculation: Tracks the precise interaction between price and volume to identify aggressive buyers vs. passive sellers.
Dual Calculation Modes: Choose between "Buy/Sell" (aggressive) or "Buy/Sell/Neutral" for a more granular view of flat market periods.
Visual Delta Labels: Displays the net volume values directly above each bar, with color-coded alerts (Green for Bullish Delta, Red for Bearish Delta).
Scalable UI: Features a "Scale Down Factor" to simplify large volume numbers into readable units (10/100/1k/10k).
Key Features:
Visual Split: Clearly differentiates historical volume from real-time buying and selling flows.
Trend Confirmation: Integrated optional EMA to compare current volume surges against the average market liquidity.
Clean Interface: Professional-grade histogram styling with clear demarcation of session activity.

Apex Wallet - Adaptive Average Directional Index (ADX) & Trend DOverview The Apex Wallet Average Directional Index (ADX) is an enhanced version of the classic Wilder’s DMI/ADX system, designed to filter market noise and pinpoint trend strength with precision. Unlike standard indicators, this script features an adaptive engine that recalibrates its internal logic based on your specific trading style.
Adaptive Trading Engine The core strength of this script is its three-mode preset system:
Scalping: Fast-response settings (ADX 7) for quick scalp opportunities on low timeframes.
Day-Trading: Balanced settings (ADX 14) optimized for intraday sessions.
Swing-Trading: High-filter settings (ADX 21) designed to capture major market waves.
Visual Intelligence & Labels To ensure clarity, the script features a dynamic labeling system directly on the ADX line:
Trend Strength Zones: Clear horizontal markers for "Consolidation," "Trending," and "Extremely Strong" phases.
Real-time Status Labels: The ADX line changes color and displays its current state (Bullish, Bearish, or Consolidation) directly on the chart.
Optimized UI: No sidebar panels to clutter your view; all essential information is integrated into the oscillator window.
How to Use:
Select your Trading Mode in the settings.
Monitor the ADX color: Green indicates a strong bullish trend, Red indicates a strong bearish trend, and White/Orange signals consolidation.
Use the labels to confirm if the market is currently in a high-conviction trend phase or sideways range.

Apex Wallet - Volume Profile: Institutional POC & Value Area TooOverview The Apex Wallet Volume Profile is a professional-grade institutional analysis tool designed to reveal where the most significant trading activity has occurred. By plotting volume on the vertical price axis, it identifies key liquidity zones, value areas, and market fair value, which are essential for order flow trading and identifying high-probability support and resistance.
Dynamic Multi-Mode Engine This script features an intelligent adaptive lookback system that automatically adjusts based on your timeframe and trading style:
Scalping: Fine-tuned for 1m to 15m charts, focusing on immediate liquidity.
Day-Trading: Optimized for intraday sessions from 5m to 1h timeframes.
Swing-Trading: Deep historical analysis for 1h up to daily charts.
Institutional Data Points
Point of Control (POC): Automatically identifies and highlights the price level with the highest total volume.
Value Area (VAH/VAL): Calculates the range where 70% (customizable) of the volume occurred, representing the "Fair Value" of the asset.
HVN & LVN Detection: Spots High Volume Nodes (significant support/resistance) and Low Volume Nodes (rejection zones).
Delta Visualization: Toggle between Bullish, Bearish, or Total volume distribution for precise buy/sell pressure analysis.
Professional UI The profile is rendered with high-fidelity histograms that can be offset to avoid overlapping with price action. It features clear labels and dashed levels for institutional markers, ensuring a clean and actionable workspace.

Crypto MMFCrypto MMF Indicator:
The Crypto Money Flow (MMF) indicator represents an advanced technical analysis tool specifically designed for cryptocurrency markets. This document outlines the logical foundation for its component integration, explains the synergistic mechanisms between its constituent elements, and provides practical implementation guidance without making unrealistic performance claims.
Integration Rationale
Volume-Weighted Momentum Analysis
The primary integration rationale combines price momentum with trading volume—two fundamental market dimensions frequently analyzed in isolation. Traditional momentum oscillators like RSI measure price velocity but ignore transaction volume, potentially misrepresenting conviction behind price movements. By multiplying price changes by corresponding volume, the indicator creates a conviction-weighted momentum measure that distinguishes between high-volume breakouts and low-volume price fluctuations.
The theoretical foundation for this integration stems from market microstructure theory, which posits that volume accompanies informed trading. In cryptocurrency markets—where volatility is pronounced and manipulation attempts occur—volume confirmation provides valuable filtering of meaningful price movements from noise.
Multi-Timeframe Momentum Convergence
The second integration layer incorporates higher timeframe analysis, acknowledging that markets function across temporal hierarchies. While shorter timeframes offer precision for entry and exit timing, longer timeframes establish directional bias and filter out insignificant counter-trend movements. This multi-timeframe approach follows established technical analysis principles that prioritize trend alignment across time horizons.
This integration is particularly relevant for cryptocurrency traders, as these markets exhibit strong momentum characteristics where higher timeframe trends often dominate shorter-term fluctuations. The higher timeframe component serves as both a trend filter and early warning system for momentum divergences.
Component Synergy Mechanism
Core Calculation Components
Price-Volume Integration Engine
The indicator begins by calculating the average of open, high, low, and close prices (OHLC4), providing a balanced price representation less susceptible to intra-period anomalies. This value undergoes differencing to establish direction, then multiplies by volume to create volume-weighted momentum values. This transformation produces two separate data streams: upward volume-weighted momentum and downward volume-weighted momentum.
Exponential Smoothing Application
Both momentum streams undergo exponential smoothing using Wilder's Relative Moving Average methodology. This approach applies greater weight to recent observations while maintaining memory of historical patterns, striking an optimal balance between responsiveness and noise reduction. The smoothed upward and downward momentum values create a ratio representing the relative strength between buying and selling pressure.
Normalization Process
The momentum ratio undergoes mathematical normalization to produce a bounded oscillator ranging from 0 to 100. This normalization enables consistent interpretation across different market conditions, timeframes, and cryptocurrency pairs, establishing standardized overbought and oversold thresholds.
Multi-Timeframe Synchronization System
Hierarchical Timeframe Calculation
The indicator dynamically determines appropriate higher timeframes based on user-defined multipliers and current chart intervals. This automated calculation eliminates manual timeframe selection errors while ensuring logical temporal relationships between analyzed periods.
Cross-Timeframe Data Retrieval
A secure data retrieval mechanism accesses higher timeframe momentum calculations without introducing future bias or repainting. This process maintains data integrity while enabling direct comparison between current and higher timeframe momentum conditions.
Higher Timeframe Smoothing Layer
An additional exponential moving average smooths the higher timeframe data, reducing noise and creating a stable reference signal for divergence analysis. This smoothing parameter is independently adjustable, allowing users to balance sensitivity and stability according to their trading style.
Signal Generation Framework
Threshold-Based Zone Analysis
The indicator establishes three operational zones based on statistical observations of momentum extremes:
Neutral zone (25-75): Represents balanced market conditions
Lower extreme zone (0-25): Indicates potential oversold conditions
Upper extreme zone (75-100): Indicates potential overbought conditions
These threshold levels derive from empirical observations of momentum oscillator behavior in trending and ranging cryptocurrency markets, though optimal values may vary across different market regimes.
Conditional Signal Categorization
The system monitors four distinct momentum conditions:
Initial extreme readings: Momentum enters extreme zones without confirmation
Confirmed extremes: Smoothed momentum follows into extreme zones
Multi-timeframe alignment: Current and higher timeframe momentum move in concert
Multi-timeframe divergence: Current and higher timeframe momentum diverge
Each condition category carries different interpretive implications, with stronger signals emerging when multiple conditions converge.
Practical Implementation Guidelines
Functional Applications
Trend Confirmation Protocol
When price trends directionally with momentum maintaining consistent readings above or below the midpoint (50), and higher timeframe momentum confirms the direction, this suggests sustainable trend conditions. The volume-weighting component further validates whether significant trading activity supports the price movement.
Divergence Detection Methodology
Three divergence types merit monitoring:
Classic divergence: Price reaches new extremes while momentum fails to confirm
Hidden divergence: Price retraces within a trend while momentum suggests trend continuation
Timeframe divergence: Momentum moves opposite directions across timeframes
Divergence analysis proves most reliable when occurring in conjunction with other technical factors such as support/resistance levels or chart patterns.
Zone-Based Risk Assessment
The oscillator's bounded nature facilitates structured risk assessment:
Extreme zone entries: Higher potential reward but require confirmation
Neutral zone movements: Lower signal clarity but potentially favorable risk-reward ratios
Zone transitions: Often precede accelerated price movements
Parameter Configuration Philosophy
Core Parameter Settings
The default parameters balance responsiveness and reliability across diverse cryptocurrency market conditions. The 14-period calculation length aligns with conventional momentum oscillator standards, providing sufficient data for meaningful smoothing while maintaining sensitivity to recent market developments.
Multi-Timeframe Multiplier Selection
The default 3x multiplier creates meaningful temporal separation without introducing excessive lag. This multiplier proves particularly effective for swing trading horizons, though position traders may benefit from larger multipliers while shorter-term traders might reduce this value.
Smoothing Parameter Considerations
Dual smoothing parameters (primary and higher timeframe) allow independent adjustment of sensitivity. More volatile cryptocurrency pairs typically benefit from increased smoothing, while less volatile conditions may permit reduced smoothing for earlier signal generation.
Interpretation Protocol
Step 1: Momentum Context Assessment
Begin analysis by determining the current momentum context:
Absolute level relative to threshold zones
Direction and velocity of recent momentum changes
Relationship to the midpoint (50) level
Step 2: Timeframe Alignment Evaluation
Compare current and higher timeframe momentum:
Confirm directional alignment for trend trading
Identify divergences for potential reversal scenarios
Assess convergence strength for position sizing decisions
Step 3: Volume Confirmation Analysis
Evaluate whether recent volume patterns support momentum readings:
Extreme momentum with declining volume: Caution warranted
Neutral momentum with increasing volume: Potential breakout precursor
Confirmed momentum with expanding volume: Higher conviction signal
Step 4: Market Context Integration
Correlate momentum readings with broader market context:
Correlated cryptocurrency movements
Overall market capitalization trends
Relevant news or fundamental developments
Originality and Differentiation
Innovative Design Elements
Volume-Integrated Momentum Calculation
Unlike conventional momentum oscillators that analyze price in isolation, this indicator integrates volume as a conviction multiplier. This integration follows logical market principles where volume validates price movements, creating a more robust momentum assessment particularly valuable in cryptocurrency markets where volume manipulation attempts occasionally occur.
Dynamic Timeframe Adaptation
The automated timeframe calculation system eliminates manual timeframe selection while ensuring logical temporal relationships. This approach reduces user error and maintains consistency across different charting intervals and trading instruments.
Multi-Layer Confirmation Framework
The indicator employs three analytical layers: raw momentum, smoothed momentum, and higher timeframe momentum. This layered approach provides graduated confirmation levels, allowing traders to distinguish between preliminary signals and confirmed conditions.
Theoretical Foundations
The indicator's design incorporates elements from multiple technical analysis disciplines:
Momentum analysis principles from oscillator theory
Volume-price relationships from market microstructure
Multi-timeframe analysis from hierarchical trend theory
Statistical normalization from quantitative analysis
This interdisciplinary approach creates a comprehensive tool addressing multiple dimensions of market analysis rather than focusing on isolated phenomena.
Risk Management Integration
Signal Quality Assessment
The indicator facilitates signal quality evaluation through multiple confirmation requirements:
Primary momentum extreme reading
Smoothed momentum confirmation
Higher timeframe alignment or constructive divergence
Supporting volume characteristics
Signal strength varies with the number of confirmed elements, enabling proportionate position sizing and risk allocation.
False Signal Mitigation
Several design elements reduce false signal susceptibility:
Volume-weighting filters low-conviction price movements
Exponential smoothing reduces noise-induced fluctuations
Multi-timeframe analysis filters counter-trend movements
Graduated confirmation requirements prevent premature action
These mechanisms collectively improve signal reliability while acknowledging that no technical indicator eliminates false signals entirely.
Implementation Considerations
Cryptocurrency Market Specificity
The indicator incorporates design elements particularly relevant to cryptocurrency markets:
24/7 market operation accommodation
High volatility regime compatibility
Volume data availability considerations
Cross-market correlation awareness
These adaptations enhance effectiveness in cryptocurrency trading environments while maintaining applicability to traditional financial markets.
Customization Guidelines
Users may adjust parameters based on:
Trading timeframe (scalping, day trading, swing trading)
Cryptocurrency pair characteristics (volatility, volume profile)
Risk tolerance and trading style
Market regime (trending, ranging, transitional)
Empirical testing across different parameter sets and market conditions provides the most reliable customization guidance.
Conclusion
The Crypto MMF indicator represents a logically integrated analytical tool combining volume-weighted momentum analysis with multi-timeframe perspective. Its component synergy creates a comprehensive market assessment framework while maintaining practical implementation feasibility. Users should integrate this tool within broader trading methodologies, combining its signals with additional technical, fundamental, and risk management considerations.
The indicator's value derives from its structured approach to market analysis rather than predictive capabilities. By providing organized information about momentum, volume relationships, and timeframe interactions, it supports informed trading decisions within appropriate risk parameters.

Clean CPR v7.0 (Call & Put)// --------------------------------------------------------------------
// DESCRIPTION
// --------------------------------------------------------------------
// Clean CPR v7.1 is a multi-module trading and analysis toolkit built
// around Central Pivot Range (CPR) for intraday and swing trading.
//
// Core features:
// • Daily / Weekly / Monthly CPR with fills, labels and price display
// • Automatic CPR width classification (Super Narrow → Wide)
// • Visual alert when today’s CPR is WIDE (“WIDE CPR TODAY”)
// • Trade filtering: Wide CPR days are blocked from new entries
// • Pivot-based Support & Resistance (R1–R5, S1–S5, optional historical)
// • Developing CPR and Developing R1 / S1 levels
// • Previous Session High/Low with optional shaded zones
// • Dual Donchian Channels with auto-alignment coloring
// • Anchored Day-Open VWAP
// • Initial Balance (first hour range)
// • CPR + ATR + EMA + Fundamentals information table
// • Integrated 1H Call & Put breakout strategy with Supertrend, ADX,
// ATR trailing stop, targets, gap handling and time filters
//
// This script is designed as a single dashboard combining market bias,
// volatility, structure, and execution logic in one indicator.
// --------------------------------------------------------------------

Crypto Precision Signals "Crypto Precision Signals - Reliable" Script Comprehensive Documentation
This document aims to clearly and objectively explain the functional principles, design logic, and usage methods of the "Crypto Precision Signals - Reliable" Pine Script. We adhere to principles of transparency and pragmatism. All descriptions are based on publicly available technical analysis theories, and we make no promises regarding any definitive profit performance. Final trading decisions should be made independently by the user based on comprehensive market analysis.
I. Core Design Philosophy and Originality
The originality of this script lies not in creating new analytical indicators, but in constructing a decision-making framework based on multi-dimensional condition confluence and systematic risk control. Its core philosophy is: a signal from a single indicator has limited reliability, whereas signals from different analytical dimensions (trend, momentum, overbought/oversold levels, market participation) can, when converging under specific rules, potentially identify higher-probability trading environments. Furthermore, the script encourages more disciplined trading through mandatory cooldown mechanisms and visual state tracking.
II. Detailed Explanation of Integration Rationale and Synergistic Operation Mechanism
The script integrates four classic technical elements, and their selection and combination have clear logical justification:
1. Trend & Momentum Foundation Layer: MACD
Integration Rationale: MACD is a classic tool for identifying trend direction, momentum strength, and potential turning points. The crossover of its fast and slow lines is an intuitive representation of momentum change, providing the initial "action signal" for the system.
Synergistic Mechanism: In this script, a MACD golden cross or death cross is one of the primary conditions for triggering a potential buy or sell signal. It acts as the system's "engine," responsible for identifying the initiation of market momentum.
2. Overbought/Oversold & Auxiliary Trigger Layer: RSI
Integration Rationale: RSI measures the speed and magnitude of price changes to gauge overbought or oversold market conditions. It complements the trend-following MACD by providing reference points for market sentiment extremes.
Synergistic Mechanism: The script innovatively sets RSI extremes (<30 oversold, >70 overbought) as trigger conditions parallel to MACD crossovers. This means the system can capture not only trend initiation points but also potential reversal opportunities from extreme sentiment (e.g., a buy point after a pullback to key support within an uptrend due to short-term oversold conditions). MACD and RSI together form a dual-trigger engine of "trend momentum" and "market sentiment."
3. Trend Filter Layer: 50-Period Simple Moving Average (SMA)
Integration Rationale: "Trading with the trend" is a core tenet of technical analysis. The SMA-50 is widely used as a benchmark for medium-term trends.
Synergistic Mechanism: This layer acts as a strict "direction filter." All potential signals generated by MACD or RSI must pass the SMA-50 test:
Buy Signal: The current price must be above the SMA-50, ensuring the trade attempt aligns with the potential medium-term uptrend.
Sell Signal: The current price must be below the SMA-50, ensuring the trade attempt aligns with the potential medium-term downtrend.
This mechanism effectively filters out numerous counter-trend, high-risk reversal attempts, focusing the system on "trading with the major trend" opportunities.
4. Volume Confirmation Layer: Dynamic Volume Average
Integration Rationale: Volume is key to gauging market participation and the authenticity of price movements. Price breakouts or signals lacking volume support are often weak.
Synergistic Mechanism: This is the key validation layer of the script. The system calculates a 30-period average volume and allows users to set a multiplier (default 2.0). A signal is only finally confirmed when the trigger condition (from MACD or RSI) occurs simultaneously with the current bar's volume being significantly higher than the recent average (i.e., a "volume spike"). This validation ensures the signal is supported by broad market participation, aiming to increase the signal's credibility and reduce "false breakouts" or whipsaws caused by low liquidity.
Synergistic Operation Summary:
The script operates like a multi-stage screening funnel:
Signal Trigger: Initiated by a MACD crossover or RSI entering an extreme zone.
Preliminary Trend Screening: The price location of the trigger signal must pass the SMA-50 trend filter (buy above, sell below).
Energy Validation: Concurrently with the above conditions, a volume spike must provide confirmation.
Final Output: Only when all conditions are met simultaneously is a visual "BUY" or "SELL" label generated.
III. Control & Auxiliary Layers: Enhancing Disciplined Use
Beyond the signal generation logic, the script includes two original designs to enhance practicality:
Signal Frequency Controller (Cooldown Period):
Mechanism: After generating a valid signal, the system enters a user-adjustable "cooldown period" (default 5 bars). No new signals of the same type will be generated during this period.
Purpose: Forces a reduction in trading frequency, prevents signal overload during high volatility or ranging markets, encourages waiting for higher-quality, more spaced-out opportunities, and helps avoid emotional overtrading.
Visual State Tracker (Bar Coloring):
Mechanism: The system internally tracks the state of the last valid signal (buy or sell). After a buy signal, subsequent bars are tinted light blue; after a sell signal, subsequent bars are tinted light orange, until the next opposing signal appears.
Purpose: Provides the user with an intuitive visual reference for the "signal validity period" or "observation phase," helping to quickly identify which stage the market is in according to the system's logic and assisting in gauging market rhythm.
IV. Functional Purpose and Usage Method
Core Purpose: Serves as an auxiliary decision-making tool for swing trading or trend-pullback entries, suitable for timeframes of 1 hour and above. It filters for potential trade nodes that combine trend alignment, momentum, sentiment, and capital interest through multi-condition confluence.
Usage Process:
Loading: Add the script to a TradingView chart.
Observation: Watch for "BUY/SELL" labels confirmed by a "volume spike" and aligned with the trend direction.
Analysis: Never treat signals as direct trading orders. Always analyze the signal within the broader market context:
Check if the signal occurs near key support or resistance levels.
Observe the candlestick patterns (e.g., Pin Bar, Engulfing patterns) on the signal bar and its vicinity.
Assess the overall market structure on higher timeframes.
Decision & Risk Control: Only consider using the signal as an entry reference if it aligns with conclusions from your other analysis tools. Any trade must have a clearly defined stop-loss level set in advance and proper position sizing/risk management.
V. Important Disclaimer
This script is a technical analysis辅助 tool. Its signals are calculated based on historical data and mathematical formulas. Financial markets carry inherent risks, and past performance is in no way indicative of future results. Users must understand that all trading decisions carry the possibility of loss. The developer assumes no responsibility for any trading activities conducted by users based on this script or their outcomes. Please use it prudently under a full understanding of its logic and associated risks.

Institutional Top-Bottom by Herman Sangivera (Papua)Institutional Top-Bottom + Volume Profile by Herman Sangivera ( Papua )
📈 Component Description
Orange Line (POC - Point of Control): This represents the "Fair Value." Institutions view prices far above this line as "Expensive" (Premium) and prices below as "Cheap" (Discount).
Green/Red Boxes (Order Blocks): These are footprints left by big banks. A Green Box is a demand zone where institutional buying occurred, and a Red Box is a supply zone where institutional selling happened.
Institutional Labels: These appear when the RSI Divergence confirms that price momentum is fading, signaling a high-probability reversal (Top or Bottom).
🚀 Trading Strategy Guide
1. The High-Probability Buy Setup (Bottom)
Look for a "Confluence" of these three factors:
Location: Price is trading below the Orange POC line (Discount zone).
The Zone: Price enters or touches a Green Order Block.
The Signal: The "INSTITUTIONAL BUY" label appears.
Entry: Enter Buy at the close of the candle with the label.
Stop Loss: Place it just below the Green Order Block.
Take Profit: Target the Orange POC line or the nearest Red Order Block.
2. The High-Probability Sell Setup (Top)
Look for a "Confluence" of these three factors:
Location: Price is trading above the Orange POC line (Premium zone).
The Zone: Price enters or touches a Red Order Block.
The Signal: The "INSTITUTIONAL SELL" label appears.
Entry: Enter Sell at the close of the candle with the label.
Stop Loss: Place it just above the Red Order Block.
Take Profit: Target the Orange POC line or the nearest Green Order Block.
💡 Pro Tips for Accuracy
Timeframes: For the best results, use 15m for Scalping, and 1H or 4H for Day/Swing Trading.
Wait for the Candle Close: Labels are based on Pivot points. Always wait for the current candle to close to ensure the signal is locked and won't "repaint."
Avoid Flat Markets: This indicator works best when there is volatility. Avoid using it during "choppy" or sideways markets with very low volume.

Fibonacci ATMAFibonacci ATMA. An ATR-adjusted EMA. This is for use with fibonacci scales for day trading and swing trading.

TSM 1987 RSI + Supertrend + High Volume StrategyRSI + Supertrend + High Volume Strategy is a rule-based trading strategy designed to capture high-probability trend reversals and continuations using a combination of trend, momentum, and volume confirmation.
The strategy uses Supertrend to identify the primary market direction, RSI to confirm momentum strength, and High Volume to validate participation from strong market players. Trades are triggered only when all conditions align, helping to filter out low-quality signals.
Each BUY and SELL signal is plotted on the chart along with the exact trade date, and the script is fully compatible with TradingView’s Strategy Tester for backtesting performance across different markets and timeframes.
🔑 Core Logic
BUY
Supertrend turns bullish
RSI is above the defined trend level
Volume is significantly higher than average
SELL
Supertrend turns bearish
RSI is below the defined trend level
Volume confirms strong selling pressure
🎯 Best Use
Works well for intraday and swing trading
Suitable for stocks, indices, crypto, and forex
Designed for trend-following with confirmation
⚠️ Disclaimer
This strategy is for educational purposes only.
Always use proper risk management and stop-loss.
Past performance does not guarantee future results.

TSM RSI + Supertrend + High Volume Strategy (BACKTESTED) 1987RSI + Supertrend + High Volume Strategy is a rule-based trading strategy designed to capture high-probability trend reversals and continuations using a combination of trend, momentum, and volume confirmation.
The strategy uses Supertrend to identify the primary market direction, RSI to confirm momentum strength, and High Volume to validate participation from strong market players. Trades are triggered only when all conditions align, helping to filter out low-quality signals.
Each BUY and SELL signal is plotted on the chart along with the exact trade date, and the script is fully compatible with TradingView’s Strategy Tester for backtesting performance across different markets and timeframes.
Core Logic
BUY
Supertrend turns bullish
RSI is above the defined trend level
Volume is significantly higher than average
SELL
Supertrend turns bearish
RSI is below the defined trend level
Volume confirms strong selling pressure
🎯 Best Use
Works well for intraday and swing trading
Suitable for stocks, indices, crypto, and forex
Designed for trend-following with confirmation
⚠️ Disclaimer
This strategy is for educational purposes only.
Always use proper risk management and stop-loss.
Past performance does not guarantee future results.

Alpha Beta Gamma with Volume# Alpha Beta Gamma with Volume
## Description
**Alpha Beta Gamma with Volume** is an advanced technical analysis indicator that combines the Alpha-Beta-Gamma (ABG) oscillator with sophisticated volume analysis. This powerful tool helps traders identify market trends, momentum, and volume-based signals simultaneously.
## Key Features
### 📊 Alpha-Beta-Gamma Oscillator
- **Alpha**: Measures the distance from the current price to the lowest price over the selected period
- **Beta**: Calculates the price range (highest - lowest) over the selected period
- **Gamma**: Normalized value showing the price position within the current range (0-1 scale)
### 📈 Advanced Price Configuration
- Multiple timeframe analysis
- Flexible price source selection (Open, High, Low, Close, or any average)
- Customizable ABG calculation length
### 🔍 Smart Volume Analysis
- Volume trend identification using moving averages
- Three-tier volume classification:
- **High Volume**: Volume ≥ 2x MA (Deep Blue Bull / Aqua Bear candles)
- **Low Volume**: Volume ≤ 0.5x MA (Light Blue Bull / Light Yellow Bear candles)
- **Strong Signal Volume**: Volume ≥ 1.5x MA (Violet Bull / Pink Bear candles)
- Bull/Bear candle color coding based on volume strength
### 🎯 Custom Range Levels (0-1 Range Divided into 8 Parts)
- 9 horizontal levels from 0 to 1 (each 1/8 apart)
- Psychological support/resistance zones
- Customizable line styles and labels
- Perfect for grid trading, breakout strategies, and level analysis
### 📊 Real-time Data Table
- Compact table displaying current ABG values
- Percentage change calculations
- Trend direction indicators
- Customizable position and size
### 🎨 Visual Customization
- Adjustable line styles (Solid, Dashed, Dotted)
- Customizable label sizes and colors
- Flexible transparency settings
- Multiple display options for all elements
## Usage Instructions
### Basic Settings:
1. **Strike Price Settings**: Select your preferred timeframe and price type
2. **ABG Parameters**: Adjust length for sensitivity (default: 37)
3. **Volume Analysis**: Configure volume thresholds based on your trading style
4. **Visual Style**: Customize colors, line styles, and labels to your preference
### Trading Signals:
- **Gamma Values**:
- 0-0.5: Oversold/Buying zone
- 0.5-1: Overbought/Selling zone
- **Volume Confirmation**: Use volume colors to confirm trend strength
- **Custom Levels**: Watch for price reactions at 1/8, 2/8, 4/8, 6/8, and 7/8 levels
### Recommended Configurations:
- **Scalping**: Length = 20-30, enable Alpha-Beta logic
- **Swing Trading**: Length = 40-50, use custom range levels
- **Position Trading**: Length = 50-100, focus on volume signals
## Technical Details
- **Version**: Pine Script v6
- **Author**: Nurbolat Zhan
- **Interface Language**: Kazakh (fully translated)
- **Required Components**: Built-in TradingView functions only
### Volume Thresholds Explained:
1. **High Volume** (≥ 2x MA): Significant institutional activity
2. **Low Volume** (≤ 0.5x MA): Consolidation or indecision periods
3. **Strong Signal** (≥ 1.5x MA): High-probability trade setups
## Important Notes
⚠️ **Disclaimer**:
- This is a technical analysis tool, not financial advice
- Always use proper risk management
- Combine with other indicators for confirmation
- Past performance doesn't guarantee future results
📈 **Best Practices**:
1. Use ABG for trend identification
2. Confirm with volume analysis
3. Watch for divergences between price and indicators
4. Use multiple timeframes for better context
---
**Motto**: "Precision in analysis, confidence in execution!"
*This indicator is specifically designed for traders who want to combine oscillator analysis with volume confirmation in a single, comprehensive tool.*

Adaptive Regime Master: The Dual-Engine FrameworkAdaptive Regime Master: The Dual-Engine Framework
Overview
The Adaptive Regime Master: The Dual-Engine Framework is a sophisticated technical analysis tool designed to solve the "Indicator Paradox"—the reality that trend-following tools fail in sideways markets, and mean-reversion tools fail in strong trends.
Instead of forcing a single mathematical model onto an ever-changing market, this framework utilizes a Master Switch logic. It continuously analyzes market volatility and directional strength to dynamically toggle between two specialized trading engines. By identifying the current "Market Regime," the indicator automatically reconfigures its visual interface and signal logic to match the environment.
The Dual-Engine Architecture
The framework operates on a logic-gate system powered by the Average Directional Index (ADX) :
1. The Momentum Engine (Trendy Regime):
Activation: Triggered when ADX rises above the 25 threshold, signaling a confirmed trend.
Logic: Utilizes a combination of Exponential Moving Averages (EMA) for trend-following and MACD Histogram for momentum confirmation.
Visuals: The chart de-clutters to show only the EMA trend-line and momentum-based signals.
2. The Mean-Reversion Engine (Choppy Regime):
Activation: Triggered when ADX falls below 25, signaling a range-bound or consolidating market.
Logic: Switches to Bollinger Bands and the Relative Strength Index (RSI) to identify overextended price action at the range extremes.
Visuals: The EMA disappears, and the chart displays Bollinger Bands to help users visualize the "value area" and potential reversal zones.
Key Features
Alternating Signal Logic: Built-in state management ensures that signals always alternate (Buy → Sell → Buy). This prevents "signal clustering" and provides a clean, actionable roadmap for the user.
Dynamic ATR-Based Protection: The indicator calculates Stop Loss (SL) and Take Profit (TP) levels using the Average True Range (ATR) . Crucially, the multipliers adjust based on the regime: wider stops for volatile trends and tighter stops for quiet ranges.
Intrabar Execution Guard: To prevent "false exits," the framework includes a calculation safeguard that prevents SL/TP triggers on the same candle as the entry, ensuring the trade has room to breathe.
Real-Time Regime Dashboard: An on-chart table provides an immediate summary of the current ADX value, the active engine mode, and the current position status.
Visual Regime Indicator: Background color changes dynamically—Blue for Trend Mode, Orange for Range Mode.
Comprehensive Alert System: Built-in alerts for Long Entry, Short Entry, TP Hit, and SL Hit events.
How to Use
Identify the Background: A Blue background indicates the Momentum Engine is active; an Orange background indicates the Mean-Reversion Engine is active.
Execution: Follow the BUY and SELL labels. The framework handles the logic of whether it is a "breakout" or a "reversal" based on the active engine.
Risk Management: Once a signal appears, Red (SL) and Lime (TP) crosses will appear on the chart. These are your mathematical boundaries for the trade.
The Exit: The position is considered closed when price hits the SL/TP markers (indicated by orange/yellow crosses) or when an opposing signal is generated.
Monitor the Dashboard: Use the top-right table to track the current regime, ADX value, active mode, and position status in real-time.
Input Parameters
ADX Length: Period for ADX calculation (default: 14)
ADX Smoothing: Smoothing period for ADX (default: 14)
ADX Trend Threshold: Threshold to distinguish trend from range (default: 25)
EMA Length: Period for the Exponential Moving Average (default: 20)
BB Length: Period for Bollinger Bands (default: 20)
BB Multiplier: Standard deviation multiplier for Bollinger Bands (default: 2.0)
RSI Length: Period for RSI calculation (default: 14)
ATR Length: Period for Average True Range (default: 14)
ATR Mult (Trend): ATR multiplier for stop loss in trend mode (default: 1.5)
ATR Mult (Range): ATR multiplier for stop loss in range mode (default: 0.8)
Min SL % (of price): Minimum stop loss as percentage of price (default: 0.5%)
Pros and Cons
Pros:
Versatility: Performs in all market conditions, reducing the need for multiple separate indicators.
Reduced Fakeouts: Filters out "trend signals" during flat markets and "reversal signals" during parabolic moves.
Visual Clarity: Only shows the indicators relevant to the current market state, reducing cognitive load and chart clutter.
Automated Risk-Reward: Automatically plots 1:2 Risk-Reward levels based on current volatility.
Professional-Grade Logic: Implements state management to prevent signal conflicts and ensure clean alternating entries.
Multi-Timeframe Compatibility: Works on any timeframe, though optimized for intraday and swing trading.
Cons:
Lagging Nature: Like all ADX-based systems, there is a slight lag when the market transitions from a range to a trend.
Threshold Sensitivity: The default ADX threshold of 25 may need tuning for extremely low-volatility assets or different timeframes.
Not a "Holy Grail": While it filters many bad trades, sudden fundamental news or black swan events can still bypass technical logic.
Requires Discipline: Users must follow the signals and respect the SL/TP levels for the framework to be effective.
Learning Curve: New users may need time to understand the regime-switching concept and trust the automated logic.
Why Use This Framework?
Most traders lose money because they apply the wrong tool to the wrong market. They use RSI to "sell the top" of a breakout, or use Moving Averages to "buy the dip" in a sideways grind. The Adaptive Regime Master removes the emotional guesswork by mathematically defining the market state and forcing the strategy to adapt.
This is a professional-grade framework for traders who value:
Logic over emotion
Discipline over impulse
Chart cleanliness over indicator overload
Adaptive systems over static strategies
Whether you're a scalper, day trader, or swing trader, this framework provides a systematic approach to reading market conditions and executing high-probability setups with predefined risk management.
Best Practices
Never forget to adjust Stop Loss and Take Profit level related to the interval you (will) use. (Default parameters are optimized for 60m)
Always backtest the indicator on your specific asset and timeframe before live trading
Adjust the ADX threshold based on the volatility characteristics of your market
Use the framework in conjunction with proper position sizing and account risk management
Pay attention to the regime dashboard—avoid forcing trades when the market is transitioning between regimes
Set up alerts for all signal types to avoid missing opportunities
Consider fundamental analysis and news events alongside technical signals
Detailed Disclaimer
FINANCIAL RISK WARNING:
Trading foreign exchange, stocks, indices, cryptocurrencies, and commodities on margin carries a high level of risk and may not be suitable for all investors. The high degree of leverage can work against you as well as for you. Before deciding to invest in any financial instrument, you should carefully consider your investment objectives, level of experience, and risk appetite. The possibility exists that you could sustain a loss of some or all of your initial investment; therefore, you should not invest money that you cannot afford to lose.
NO INVESTMENT ADVICE:
The "Adaptive Regime Master: The Dual-Engine Framework" is an educational tool designed to assist in technical analysis. It does not constitute investment advice, financial advice, trading advice, or a recommendation to buy or sell any security or financial instrument. All content provided by this indicator is for informational and educational purposes only.
PAST PERFORMANCE:
Past performance is not indicative of future results. Hypothetical or simulated performance results have certain limitations. Unlike an actual performance record, simulated results do not represent actual trading and may not be impacted by brokerage and other slippage fees. Simulated trading programs in general are also subject to the fact that they are designed with the benefit of hindsight.
NO GUARANTEE:
No representation is being made that any account will or is likely to achieve profits or losses similar to those shown in any backtests or forward tests. The author and developers of this indicator make no warranties, expressed or implied, regarding the accuracy, completeness, or reliability of the information provided.
USER RESPONSIBILITY:
Users should perform their own due diligence and test the logic on a demo or paper trading account before applying it to live capital. You are solely responsible for your own investment and trading decisions. The author and developers assume no responsibility for any financial losses, damages, or adverse consequences incurred through the use of this tool.
ACCEPTANCE OF TERMS:
Use of this indicator constitutes acceptance of these terms and acknowledgment that you understand the risks involved in trading financial instruments.
REGULATORY NOTICE:
This indicator is not affiliated with, endorsed by, or approved by any financial regulatory authority. Always consult with a licensed financial advisor before making investment decisions.

Advanced Double Bottom Finder (Simple, M-Shape, Gull Patterns)Description: This indicator identifies three distinct types of Double Bottom patterns based on Pivot points and SMA (Simple Moving Average) filtering. Instead of a simple price comparison, it classifies patterns to provide deeper insights into market structure and liquidity.
Pattern Types:
Simple Double Bottom (DB): A classic trend reversal pattern with a "Higher Low." It indicates price stability above the recent low while staying below the SMA during the peak.
M-Shaped Double Bottom (M-DB): Occurs when the peak between the two lows breaks above the SMA, suggesting stronger bullish momentum before the second low is formed.
Gull Sweep Double Bottom (Gull): A "Liquidity Grab" pattern where the second low sweeps below the first low but recovers quickly above the SMA. This is often seen in high-volatility reversals.
Key Features:
SMA Confirmation: Filters signals by requiring a price crossover above the SMA, reducing false positives during flat trends.
Dynamic Pivot Analysis: Uses configurable left/right bar strengths for pivot detection.
Unified Alerts: Set a single alert for all patterns or monitor them visually via color-coded labels.
How to use:
Works on all timeframes. Recommended for 15M, 1H, and 4H for swing trading.
Ensure the Chart Timezone matches your local trading hours for accurate signal tracking

Mean Reversion [SIMI]This mean reversion indicator identifies extreme price deviations from the mean, providing high-probability reversal signals. Designed for confluence-based trading, it works best when combined with complementary indicators such as VWAP, price action, and volume analysis.
📊 Core Features
Signal Types
Prime Signals (Bright Green/Red Dots): Extreme reversions usually beyond ±1.5 SD - highest probability setups (you can customise this zone!)
Regular Signals (Dark Green/Red Dots): Standard reversions - moderate probability
Leader Line (Pink Dotted): Early warning indicator for potential reversals
Histogram Weakness: Momentum divergence signals
Normalisation Methods:
Institutional Hybrid (Z-ATR) (Recommended): Volatility-adjusted Z-score - adapts to changing market conditions
Percentile Ranking: Statistical ranking - excellent for ranging markets
PPO + ATR Hybrid: Percentage-based with volatility adjustment
Efficiency Ratio: Trend-strength weighted
ATR: Pure volatility-based
None: Raw Z-score
⚙️ Quick Setup Guide
1. Institutional Presets
Pre-configured parameter sets optimised for different timeframes:
5M Day Trading (5/21/5): Intraday scalping
1H Options Trading (6/24/5): Options-focused setups
1D Monthly Cycle (5/20/5): Swing trading
2. Signal Filtering
Prime Thresholds: Adjust ±1.5 SD to control signal quality (tighter = fewer, higher quality, adjust this zone per asset traded)
Dot Filters: Fine-tune entry zones (-0.03/+0.03 default - this ignores noisy signals near Zero line)
Volume Filter: Enable to require volume confirmation (1.4x average recommended, but fine tune yourself)
3. Advanced Filters
Dynamic SD Thresholds: Auto-adjusts for volatility regimes (tighter in low vol, wider in high vol)
Time of Day Filter: Avoids first 30 minutes, last 15 minutes, and lunch hour (11:30-13:00 EST)
💡 Trading Strategy Recommendations
Optimal Usage
This indicator is not intended as a standalone system. Use it for confluence alongside:
VWAP (institutional positioning)
Price action (support/resistance)
Options flow (institutional direction)
Volume analysis (conviction confirmation)
Signal Interpretation
Prime Signals: Wait for these for highest-probability entries - mean reversion may take hours to days
Manual Entries: Don't wait for dots - trade the ±2 SD zones directly using your own confirmation
Options Strategy: Prime sell signals at +2 SD make excellent short call setups; prime buy signals at -2 SD for long calls
Timeframe Guidance
Lower Timeframes (1M-5M): Higher noise - require additional confluence
Higher Timeframes (1H-1D): More reliable signals - suitable for options and swing trades
Best Results: Multi-timeframe analysis (check 1H and 4H alignment on 5M entries)
🔔 Alert System
Master Alert
Enable customisable alerts via the Master Alert System:
Toggle individual signal types (Prime Buy/Sell, SD Crosses, Leader, Histogram)
Receives bespoke messages with ticker, timeframe, and price
One alert condition handles all selected signals
Individual Alerts
Separate alert conditions available for Prime and Regular signals if preferred.
📈 Backtesting Notes
Important: Backtest results are date-sensitive and should not be the primary focus. Instead:
Dial in settings visually on your chosen asset
Aim for signals near actual tops and bottoms
Test different normalisation methods for your specific instrument
Optimise for signal quality, not backtest ROI
Asset Testing: Primarily developed using SPY, QQQ, and IWM as main assets to trade. Other instruments may require parameter adjustment - mess around!
Backtest Engine
Entry/Exit modes (All Signals, Prime Only, Early Signals)
Position sizing (percentage-based)
Slippage and fill method (candle close recommended)
Date range selection
⚠️ Best Practices
Always use confluence - never trade on MR signals alone
Start with Institutional Hybrid normalisation - most adaptive to market conditions
Focus on Prime signals for quality over quantity
Test on your specific asset - optimal settings vary by instrument
Longer timeframes = higher reliability - 1H+ for best results
Enable Time Filter on intraday charts to avoid volatile periods
Use Dynamic SD in highly volatile markets (earnings, FOMC, etc.)
🛠️ Troubleshooting
Too many signals: Increase Prime Thresholds or enable Volume Filter
Too few signals: Decrease Prime Thresholds or reduce Dot Filters
False signals: Enable Time of Day Filter and Dynamic SD
Signals don't align with tops/bottoms: Try different normalisation method
📝 Feedback & Development
Bug Reports: Please report any issues via TradingView comments or direct message.
Strategy Sharing: I'd love to hear how you're using this indicator and what strategies you've developed.
Open Source: Feel free to fork and modify this indicator. If you create an improved version, please share it with the community!
🙏 Acknowledgements
Developed through AI-assisted collaboration.
Special thanks to Lazy Bear for his open source MACD histogram (volume based).
Open source forever - use freely, modify, and share.
Happy Trading!
Remember: Past performance does not guarantee future results. Always manage risk appropriately.
Pandas rock \m/

Volume Ratio [MIT]Core Logic:
This indicator splits each bar's volume into "Buy Volume" and "Sell Volume" based on the relationship between close and open price, then calculates the rolling ratio of cumulative buy volume to sell volume over the past n bars, helping traders gauge short-term buying vs. selling pressure.
Volume Split Rules:
Bull bar (close > open): All volume assigned to Buy
Bear bar (close < open): All volume assigned to Sell
Flat bar (close == open): Handled by the "Flat bar volume" setting:
Split 50/50 (default): 50% Buy + 50% Sell
Ignore: Volume discarded (0 Buy, 0 Sell)
All to Buy: All volume to Buy
All to Sell: All volume to Sell
Calculation:
buySum = rolling sum of buy volume over last n bars
sellSum = rolling sum of sell volume over last n bars
Ratio = buySum / sellSum (na when sellSum = 0)
Ratio > 1: Buying pressure dominates (red line)
Ratio < 1: Selling pressure dominates (green line)
Visual Elements:
Green line: Rolling Buy Volume (n bars) – optional
Red line: Rolling Sell Volume (n bars) – optional
Colored line: Buy/Sell Ratio (red when >1, green when <1)
Horizontal line at 1.0: Neutral balance level
Typical Trading Use Cases:
Trend Confirmation: Ratio persistently > 1.2–1.5 while price rises → strong bullish confirmation
Divergence: Price makes higher high but ratio declines → potential top divergence
Breakout Filter: Breakout with rapidly rising ratio → higher probability breakout
Range Market Avoidance: Ratio oscillating between 0.8–1.2 → avoid choppy entries
Crypto Day/Swing Trading: Commonly used on 5m–1h charts, combined with price action or order flow
核心逻辑:
该指标基于K线的收盘价与开盘价的关系,将每根K线的成交量(volume)拆分为“买入量”(Buy Volume)和“卖出量”(Sell Volume),然后计算过去n根K线的累计买入量与卖出量的比率(Buy/Sell Ratio),用来判断短期内买卖力量的相对强弱。
成交量拆分规则:
阳线(close > open):全部成交量计入买入量
阴线(close < open):全部成交量计入卖出量
平线(close == open):根据“Flat bar volume”参数处理:
Split 50/50(默认):平分50%买入 + 50%卖出
Ignore:忽略该K线(都不计)
All to Buy:全部算买入
All to Sell:全部算卖出
计算方式:
滚动窗口n根K线内的累计买入量(buySum)和卖出量(sellSum)
比率 = buySum / sellSum(当sellSum=0时显示na)
比率 > 1:买入力量占优(红色)
比率 < 1:卖出力量占优(绿色)
图表显示:
绿色柱线:过去n根的累计买入量(可选显示)
红色柱线:过去n根的累计卖出量(可选显示)
彩色折线:买入/卖出比率(>1红色,<1绿色)
水平线1.0:平衡线(比率=1)
典型使用场景:
趋势确认:比率持续 > 1.2~1.5 且价格上涨 → 强势多头确认
背离信号:价格创新高但比率持续下降 → 潜在顶部背离
放量突破:突破关键位时比率同步快速拉升 → 突破有效性更高
震荡市过滤:比率在0.8~1.2区间反复震荡 → 避免频繁交易
币圈短线:常用于5分钟~1小时图,配合价格结构或订单流使用

Sumit' Trade line strategy (4PM-1AM)SUMIT INGOLE
This is a custom-built trading indicator designed to help traders identify clear market direction and high-probability entry zones.
The indicator focuses on: • Trend direction
• Strong price levels
• Clear buy and sell signals
• Easy-to-read structure
It is beginner-friendly and does not require complex market knowledge. The signals are based on pure price behavior and smart market movement, helping traders avoid confusion and overtrading.
This indicator works best when used with proper risk management and discipline. It can be applied on multiple timeframes and is suitable for intraday as well as swing trading.
Note:
This indicator is a support tool, not a guarantee of profits. Always follow your trading plan and manage risk properly.

Dynamic Flow Ribbon [Adaptive]The Dynamic Flow Ribbon is a next-generation trend-following tool designed to solve the two biggest problems traders face: Lag and Noise .
Unlike traditional Moving Averages (SMA/EMA) that are often too slow to catch reversals or too sensitive to chop, this indicator utilizes Rational Quadratic Kernel Smoothing . This advanced mathematical approach creates a "Flow Ribbon" that hugs price action tightly during trends while remaining silky smooth, filtering out the random noise that leads to false signals.
This is not just a crossover indicator; it is a complete Market Regime Detector . It automatically identifies when the market is trending and when it is ranging, helping you stay out of dangerous "chop" zones.
Why Use This?
Zero-Lag Smoothing: Experience the responsiveness of a fast EMA with the smoothness of a slow SMA.
Chop Filter: The ribbon automatically turns Gray when volatility (ADX) drops, signaling you to sit on your hands and preserve capital.
Visual Clarity: No messy lines. Just a clean, glowing ribbon that tells you the trend direction instantly.
How It Works
The indicator calculates two dynamic curves:
Fast Flow Line: Tracks immediate price action using a tight kernel window.
Base Flow Line: A slower, weighted baseline that acts as the trend anchor.
The Ribbon: The space between these lines forms the "Ribbon."
Green (Bullish): Fast Flow > Base Flow. The trend is Up.
Red (Bearish): Fast Flow < Base Flow. The trend is Down.
Gray (Flat): Volatility is too low (ADX < Threshold). The market is sideways.
How to Trade
This tool is best used for Trend Continuation and Reversal Catching .
The Entry: Wait for a Crossover Signal (Small Circle).
Buy when the Ribbon flips Green.
Sell when the Ribbon flips Red.
The Filter: If the Ribbon is Gray , ignore all signals. This prevents you from getting whipsawed in a ranging market.
The Exit: You can ride the trend until the Ribbon flips color, or use your own support/resistance targets.
Settings
Bandwidth (Smoothness): Adjusts the sensitivity of the kernel. Higher values = smoother ribbon (better for swing trading). Lower values = faster reaction (better for scalping).
Trend Filter: Toggle the ADX-based chop filter on/off.
Visuals: Fully customizable colors to match your chart aesthetic.
Pro Tip: Combine for Maximum Accuracy
While the Dynamic Flow Ribbon is excellent for Trend Direction, it does not plot Support & Resistance levels.
For the ultimate trading setup, I highly recommend pairing this with my AIO Pivot Master
or any other pivot indicator, which you can easily find on TradingView.
Use Dynamic Flow to determine the Direction .
Use AIO Pivot Master to find your Entry and Exit targets .
Disclaimer
For Educational and Informational Purposes Only
This indicator is provided for educational and informational purposes only and DOES NOT constitute financial, investment, or trading advice. It does not predict future market movements with certainty.
Risk Warning
Trading in financial markets (Stocks, Crypto, Futures, Forex, etc.) involves a high degree of risk and may not be suitable for all investors. You could lose some or all of your initial investment. Past performance of any trading system or methodology is not necessarily indicative of future results.
No Liability
The author of this script assumes no responsibility or liability for any errors or omissions in the content of this indicator, or for any trading losses or damages incurred as a result of using this tool. Users are solely responsible for their own trading decisions and should always use proper risk management. By using this script, you acknowledge and agree to these terms.
